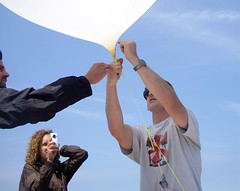
Grassroots Mapping is a series of participatory mapping projects involving communities in cartographic dispute. Seeking to invert the traditional power structure of cartography, the grassroots mappers used helium balloons and kites to loft their own “community satellites” made with inexpensive digital cameras.

Goldsmiths University, Design & Environment first session

October 19th, 2011 by Cesar Harada

20:15, 2011 10 11 London, UK.

Original post here : http://www.designandenvironment.co.uk/2011/10/aerial-mapping-session

Today, we went out mapping, or more precisely doing aerial photography, flying a digital camera under a nice big green balloon from the green of Goldsmiths University  London. The MA is Design at Goldsmiths has an option called “Design & Environment” supervised by Prof Jennifer Gabrys. It is a course that initiates students to alternatives design and environmental methods and pratices. This hands-on experiment was lead by Cesar Harada acting both as Goldsmiths tutor and Public Laboratory instructor. The mappers -who are also the authors of this post- were Anuja Uttamrao Borker, Inessa Demidova, Shan-Yu Hsu, Dk Hajah Hazwani Pg Dato Haji Jaberudin, Federica Sterpos, Chian-Yun Yang, Yifan Zhang, Elvira Grob (group picture).

The kit

<Hazwani> The purpose was to capture many images of Goldsmiths open-field area and its surrounding. In order to have these continuous green images, we created a flying balloon digital camera. We did not need complex materials to make it.

Goldsmiths University of London, Design & Environment First Aerial Mapping Session.

First of all we cut our 3l Fanta plastic bottle into half in order to place the digital camera inside the bottle top, attached with orange string onto our camera and through the bottle neck. Instead of the rest of the bottle ends up in the bin, we used it to create wings so that it becomes stable once it is up in the sky. We cut it into strips and fold them so that it became straight and folded as a rotor blades. In order to ensure the strings would not slip away, we had to make sure the cotton string was tightly taped down onto our camera.

Goldsmiths University of London, Design & Environment First Aerial Mapping Session.

  • 2. Load the balloon

Once we got everything prepared in the studio, all of us and our tutor then rushed our way behind Lockwood Building to inflate our 1 metre balloon slowly with helium. While filling the balloon, Shanyu, Fedrica and Elvira helped our tutor to hold the huge balloon so that it would not touched the ground and the things around. The other four of us were taking pictures and making notes of the process.

  • 3. Set your camera

Before we launched our balloon, we had to make sure that we set our camera on continuous mode. Then we added a bit of card paper to hold down the camera trigger and used few rubber bands to hold the paper in place. Afterwards we put on the Fanta cap once the camera was securely in place. Make sure you test bounce your camera beforehand so that it would not fall out.

Goldsmiths University of London, Design & Environment First Aerial Mapping Session.

  • 4. Finally Up! Up! – Let the balloon fly!

Roughly about 12pm at Goldsmith open field, we let our balloon rise up into the sky as quick as we can so that the wind would not prevent us from letting it rise and we take turns to wind the strings carefully. We also had to make sure that we wear protective gloves beforehand, in order to protect our hand form getting string burns and ensure that we do not let the string tangled up. We flew for almost an hour and a half mapping the green field – and the materials to make were just simple! </Hazwani>

Goldsmiths University of London, Design & Environment First Aerial Mapping Session.

The weather conditions

<ChianYun> It was a cloudy day, not perfect for taking pictures. The wind was generally from the west, sometimes changed its direction. It blew strongly. Once we passed building high, the wind became too strong and limited the rising of the flying balloon, made it difficult to control the balance. At least, it didn’t rain. </ChianYun>

Goldsmiths University of London, Design & Environment First Aerial Mapping Session.

The Flight

<Shanyu Hsu> The big balloon gradually flew into the sky. Because of strong wind, the balloon moved horizontally rather than vertically. In order to avoid it from hitting the main building, we tried to pull back the line connected with the balloon for a while and then released it again, such as playing kites, for a couple of times. Luckily, the balloon flew higher and higher. The flight route of our balloon was determined by the strength and direction of wind.</Shanyu Hsu>

The Crash

<Federica> The wind brought the balloon close to the trees, we could not control the balloon or change its course. The balloon exploded and crashed into a tree. Our tutor Cesar Harada climbed up to the roof to go and check the camera. Everybody was worried the camera would be broken… and if the experiment would be failed… The tutor finally found the camera with the rest of the material in neighbours garden.</Federica>

Goldsmiths University of London, Design & Environment First Aerial Mapping Session.
Pictures Cesar took after he found his camera following the crash, we are so emotional on them!

Final Outcome

<Inessa> When we finally got to our classroom and saw photos it turned out that the camera switched off shortly after the start of ballooning, probably the rubber band slipped off the button. As a result we have got only a few pictures and most of them were quite blurry. </Inessa>

Goldsmiths University of London, Design & Environment First Aerial Mapping Session.

<Anuja> So, in spite of the bad weather conditions, we got a few good pictures. Most importantly, we learnt a useful technique in photography and mapping. Hopefully, we will have better luck with the weather next time and it will be bright, sunny and non-windy. But overall it was a fun, educative and interesting experience.

Goldsmiths University of London, Design & Environment First Aerial Mapping Session.

The “broken rig”

Next steps

The next step would be to go map again and stitch the photograps to form a single map of the entire area.</Anuja>

<Inessa>To do so we need to use specialized software of Adobe Photoshop. Some kind of panorama-making software might be used to automatically stitch photos and get pretty neat aerial view of area with all the details. After that this images might be used for a wide range of purposes. </Inessa>

What Mapping can be used for. Historical perspective. Contemporary use of aerial photography.

</Yifan> Mapping can be used for  field-based research but can also be used for divergent thinking in a very wide range of field.


Image found here.

Aerial mapping can be a useful tool to analyse a location from the past to present day, tracking its development over time. For Example, it can be used in urban planning (architecture, landscape and etc.), human and animal habitat study, to give people a clear indication of how a development may impact the environment.

From a historical perspective, mapping has been used in a vast diversity of fields, from scientific to artistic to critical political purposes. Not only the scope of mapping has been rapidly developed, also the technologies have progressed.

The contemporary use of aerial photography can be seen from different scales of work, such as environmental projects, film shooting and city planning. It gives an opportunity to both professional and the general public to have an intuitive understanding how themselves relate to the whole, and think out of box! </Yifan>

<Inessa> The main feature of “grass-root” mapping is that it is relatively inexpensive and allows us to create quite high-quality images with relatively small efforts, that can be used by almost everyone who need it. So, not only government and big corporations, but small organisations and even students can get all the advantages of aerial photography.</Inessa>


<Cesar> PS : We still have a lot of helium in the cylinder – for possibly 2 flights. The weather conditions were not very good today unfortunately, who is interested in doing another mapping session? Please say it in the comments :)

For UK reference, we ordered our equipments here :

  1. Balloon £13.27 : Balloons.co.uk (this balloon is big but fragile, don’t inflate too much, it will burst after a few minutes. I recommend buying 2 and stay well under burst point)
  2. Line £25.8 from the Balloonshop.com
  3. Helium £83.91: from BOC “grey day helium”, 9.1 m3, Type of cylinder : L (it is huge, you need 2 people to move it around), £68.88 Cylinder, £15.03 Delivery, Product serial number : 101720-L
  4. CameraOlympus TG-810

Special thanks to Jane Godsal, UK-based-Balloon-artist for her precious advices ! </Cesar>

#Occupy#Wallstreet Aerial Mapping

October 11th, 2011 by Shannon Dosemagen

Post written by Oscar Brett

Arriving at Zucotti Park in downtown Manhattan, the site of #Occupy#Wallstreet, you can feel the energy of the crowd. The level of diversity (ideological/ ethnic/ generational) is unbelievable. The Occupation of Wall Street began on September 17th and it is getting stronger each day. I see my involvement in the park as that of a community builder and artist. The maintenance of a community at Zucotti park is an incredibly important thing; no matter how disparate the media claims the thousands of occupiers to be, there is one thing for certain — they are a community made up of individual people, with varying goals and intentions, voicing their dissent for the systemic problems of the world. Political, ethical, legal, societal, economic qualms are all being voiced in this space, but a major issue exists: how do you bring the animal rights expert together with the Marxist economist, the LGBT advocate together with the anarchist; how can so many ideologies gel?

My role has been to try and unite people through communal exercise which takes the form of public (or community) based art– this was exactly the purpose of using community involvement to build, and fly, a weather balloon rig and map an #Occupy#Wallstreet march on October 5th.

This project would have been impossible without the help of Leif Percifield and Liz Barry. On the night of October 4th, I met with them and they supplied me with all the equipment I needed: line (2x 40lb of 250ft and 1 100lb of 250ft), a 4GB sd card, and a supply of tape. The SD card was loaded with a script that enables a Cannon Powershot to shoot continuously without having to hold down the shutter button.

Later that night I took a 2am train to the Lower East Side to purchase a Cannon Powershot A495 (a lightweight point and shoot which is great for flying) that Leif located on Craigslist. By 4am the camera casing was built and the camera was ready for shooting the next morning. The actual construction of the rig would occur at Zucotti park the following morning.

Upon arrival at the park the next day I linked up with the #Occupy#Wallstreet media working group and began preparation for the flight. The media working group funded the balloons and helium; 100 12inch rainbow party balloons were purchased (pre filled) from Balloon Saloon on West Broadway and Duane, costing $125. The balloons arrived at the park at around 2pm, one hour prior to the march. I preemptively cut 10 lines of 10ft cotton chord to be used in the rigs construction. I attempted to get as many people involved in as many elements of the construction as possible; I hollered at people in the park to hold this, cut that, or wind these. People were very excited to take part in any form of constructive action.

The construction of the actual weather balloon rig engaged between 50 and 75 occupiers. The police have vetoed our right to use forms of voice amplification, which has spurred an ingenious and highly democratic approach to addressing a crowd. A metaphysical device called the “peoples’ mic” was created. The addressor yells “Mic check!” and everyone who can hear her/him responds by echoing “mic check”, the addressor then speaks in short sentences and allows for the chorus of people closest to them to echo what they are saying. It is in this way that the message is passed through a large crowd [each message often has upwards of 3 echos from the first people who hear it to those on the periphery of the crowd]. I utilized the “peoples mic” to address those who were constructing the rig.

I addressed the crowd and asked 10 people to pick up the ends of the ten strings; an additional person then secured each of the ten strings to a key ring. This produced a circular decapus (think octopus) structure of cotton line about twenty feet in diameter. I then held a small lesson on tying very basic slip knots and instructed folks to tie ten slip knots on each line (aprox. 1 foot apart from each other). This task of tying 100 slip knots only took about 10 minutes because there were at least 25 to 30 additional participants tying them. Even more people cued up in front of the two massive bags of inflated balloons to pick up one balloon at a time, insert the balloon ties into the prefabricated slip knots, and tighten them. I was amazed at the fact that not one balloon popped or flew away during this operation. The free ends of ten balloon strings were then secured to an additional key ring and let go to rise into the air. This produced in theory a balloon globe; however, in practice it resembled more of a bundle. People were very excited to be taking part in such a communal event. There was constant giddy dialogue between the participants, exchanges of numbers and contact information, and a general good vibe.

The Balloon bundle was attached to a fishing clip, via its bottom key ring and the two 40lb lines and the 100lb line was attached to the clip. The decision to use three lines to control the rig was made for two reasons. First we felt it would be easier to control the rig in the narrow space between skyscrapers with three points (a triangle) on the ground; and second, we were not sure how police would respond so we wanted to ensure the return of the images even if one of us was handcuffed/ tackled by the police [the plan was for the remaining two pilots to pull the rig in immediately and secure the SD card if the third one was immobilized by police].

The process of mapping began at the north east corner of Zuccotti park just as the march began; It had been previously disclosed to me that the march would attempt to cross the Brooklyn bridge so the 15 block walk from Zuccotti seemed not to daunting a distance. Myself and two other members of the protest controlled the reels, there were probably five other marchers who constantly stayed with us either documenting, aiding in communication between us three controlling the rig, or reeling in excess line at moments when time was of the essence.


We made it about two blocks up Broadway successfully, before our first snag occurred. Upon hitting a cross street a gust of wind blew one of the lines into the crux of a lamp pole. Our solution was to fly the balloon close enough to the lamp pole (using the other two balloons) to slacken the stuck string. This same problem occurred at least three more times, and one of the times we had to cut and reattach one of the three lines.


Our plan was to start at the front of the procession and walk slowly so as to allow for the entire procession to pass us by the end of the march. By starting at the front and ending at the back we believed we would produce both a map of the physical route taken by the processors as well as allow for the full documentation of all marching bodies in space. In practice this was made difficult by multiple factors; the corralling of people by the police inhibited us from moving freely between both sidewalks and the street, the unpredictable nature of the crowd speed, as well as issues of tangling lines. We took the balloon down and put it up pretty frequently, at one point there were low hanging trees at another there was scaffolding; needless to say we didn’t photography the walk in its entirety. Among the best imagery we gathered was the walk from Printing House Square to half way down the Brooklyn bridge as well as the police barricade on the Brooklyn side of the bridge. We also gathered some pretty good shots on the walk up Broadway from Zuccotti park.

This map was made using Mapknitter, an open source program that allows for direct manipulation of photographed images over a satellite backdrop, I used a google map backdrop. View the map here: http://mapknitter.org/maps/2011-10-01-newyork-occupywallstreet

Special thanks to Zach, Tim, Blaine, Yaeir, Anjali, Louis.

–Oscar Brett

Trees, Chainsaws, Protest and Balloons

September 27th, 2011 by Shannon Dosemagen

Blog post written by Jaroslav Valuch (@jvaluch or j.valuch@gmail.com)

It was a pretty hot summer. In July, the calmness and silence in the heart of Sumava, the biggest and strictly protected natural park in the Czech Republic, was replaced by the sound of chainsaws and massive police action.

It is usually bark beetle calamity that repeatedly raises controversy around the issue of “to cut or not to cut”. In a strong simplification, the bark beetle attacks the trees and kills them. The traditional forest management approach pushes for cutting infected trees to prevent the beetle from spreading. The modern environment-friendly approach suggests to leave nature to deal with itself – some of the temporary generations of trees will die, but in turn will provide cover for a new generation of trees, that will grow stronger and more resilient to any future bark beetle infestations. However, in clear-cut areas which are unprotected from further destruction by storms and wind, new generations of human-planted trees grow to be too weak for resisting future beetle attacks.

Sumava National Park has had to repeatedly face attacks on its strict level of ecosystem preservation. Local business lobbyists backed by political pressures would prefer to see Sumava open to the construction of ski resorts and infrastructure for mass tourism. Therefore, a wild, difficult to access forest obviously does not correspond with such a vision.

The Czech law is clear – any intervention in the protected areas of natural parks that can significantly impact the local ecosystem is prohibited. In extreme cases, exceptions can be granted. This summer, there was a large logging intervention, but no accompanying legal permission.

This act triggered activist protests which insisted that companies follow the law. In order to prevent illegal cutting, activists started blocking the cutting themselves. Blockades triggered a massive police intervention that attempted to push activists out of the forest. It took four weeks of chaining, tubing, and arrests. The forest was not saved, but one of the goals– to draw the public attention and raise discussion around this issue– was successful.

Once the chainsaws went silent, and the police left the forest, the time for proper documentation of the damage had come. Experts observed the cut trees, many of which actually were not attacked by the bark beetle at all. Simultaneously, visual and geographic documentation took place from a ground perspective.

Cut Area Map

Sumava Cut Area

Inspired by the Grassroots Mapping of the BP oil spill, we decided to try to get our own “satellite” imagery in order to document the devastation in its full scale, have something to present it to public, and to use for any legal action that should follow. We reached out to Shannon and Stewart from Public Laboratory and quickly received some initial thoughts, guidance and support. Soon we were on our way back to the forest with balloons, a camera, a bottle of helium and enthusiasm. It is a piece of cake, we thought, planning to cover all areas in one day. The disillusion came quickly: not enough balloons, too much wind and trees all around. Finally, when our awkward tangle of balloons took off, full of excitement and drunk by the success, we refused to pull the balloons back in time. The wind and trees did their job. As a result, we lost balloons and the camera.

View: Ballon Mapping Fail #1

Having zero images and no more helium, we left the forest, but did not give up. Next week we were back: with a new camera, bigger balloons and a friend who is a climber and managed to get the old camera from the treetop. The imagery was there, however, we didn’t fly high and long enough to get proper imagery.

Our second attempt went smoothly. At 5pm the wind stopped, and the balloons went straight up. In 60 minutes, we had one of the areas covered, hoping we had enough good quality images to merge the pictures into a single layer. And we did. Photoshop CS5 did its job perfectly. As we didn’t have too many images, we didn’t need to use the PLOTS MapKnitter. However, one problem did occur. We had nice single layer imagery, but not enough geo specific data to place it correctly onto a map by using MapKnitter. Simply, there were not enough objects that we could use to scale the image to the right location in the right size. For next time, we plan to geolocate the area more properly. We are thinking about placing three white flipchart papers onto the area, geolocating each of them and than placing the merged image with three visible white papers onto the correct coordinates.

As it stands today, after almost 6,000 trees were cut, the inspection by the Ministry of Environment finally took place, investigating whether the cutting intervention did significantly impact the local ecosystem or not. We now have our own evidence that will be used for three purposes: First, to document the scale of damage. Second, to observe during time how much of the wood will remain in place (despite the fact that the majority of the wood mass should remain on spot, every single tree was cut into logs of precisely 4.1 meters in size, a standard size for trucks. It wouldn’t be the first time when such high-quality wood “disappeared” suddenly). It is the third purpose that is most important – this sends a clear message that we are watching, and that no further logging operation will remain covered-up.

We are also currently launching a Ushahidi based platform (note that this is still a site concept) as a space for gathering all available imagery and testimonies in order to provide a repository for any future reference and planning. Next time, we need to act faster and deploy during the operation, not only after it.

Our key lesson learned while mapping:

While mapping in difficult to access environments, you need to be ready and well prepared: two cameras and enough balloons (note – dogs hate inflating of the balloons) are essential. We plan to try to use kites next time as well. But the bottom line is: Don’t give up!

A list of equipment used for this project:

- Camera Canon Powershot A495 – cheap, but little bit too heavy. Need to crack the firmware in order to enable unlimited continuous shooting.
- SD card – max 2GB SD card enabled the crack for continuous shooting to work, set up 1 image per 3 seconds (the capacity of 2 GB SD card was just enough for some 20-30 minutes of ballooning). Some one third of pictures was sharp enough which was sufficient.
- 5l helium bottle (just enough for one ballooning session)
- 2 party balloons 160cm size, one 90 cm size (at least another three as a backup).
- Light string 150 meters (wish we had more)
- Plastic bottle as a cover
- Laptop
- Tons of AA back-up batteries

Wetlands loss imagery from Bayou St. Denis, Louisiana

September 21st, 2011 by Jeffrey Warren

I’ve heard Shannon Dosemagen cite “a football field of wetlands loss every 30 minutes” along the Louisiana gulf coast, due to lower freshwater inflow/silt deposition, contamination, wake, and other issues. I was working on a map of balloon images of Bayou St. Denis recently and compared our imagery to that of Bing, which is a few years old. I believe these are pretty well lined up, based on the stream intersections, and you can clearly see the amount of land missing in the more recent images.

http://publiclaboratory.org/notes/warren/9-21-2011/wetlands-erosion-bayou-st-denis-louisiana

http://mapknitter.org/tms/bayou-st–denis/openlayers.html

I wonder how old the Bing imagery is. Google has stuff from a few weeks after the oil spill. Though it’s difficult to align these datasets given that the land itself is changing shape, the high resolution of the images that grassroots mappers captured makes it an interesting way to quantify wetlands loss. Hopefully our ongoing collaboration with Louisiana Universities Marine Consortium (LUMCON) will yield even more data for this area.

Compared to the Google Maps vector coastlines, there’s been even more loss; presumably these aren’t updated every time new satellite data is available:

Screen shot 2011-09-21 at 1.39.03 PM

Balloon Mapping in Santiago; Seeing Protests from a Different Perspective

August 18th, 2011 by Shannon Dosemagen

Written by Elizabeth Wolf, Fundación Ciudadano Inteligente

The recent months of 2011 have marked the manifestation of student frustration with the Chilean education system. Hundreds of thousands of university and secondary students have flooded the streets of Santiago and other cities across Chile, in a series of protests demanding: lower tuition, more opportunities to access public universities, better quality education, and increased government spending on education, including more scholarships for lower class students.

The Chilean government spends less on education than most developed countries: 4.4% of its GDP, compared to the average 7%, which means a good portion of Chilean students pay for their own university education. With the combination of being one of the most socially stratified countries in the world, (40% of the country’s wealth is concentrated in 10% of the population), and the high costs of education, many students do not have the ability to attend a quality university. The Piñera administration and the leading group of Chilean students, along with their supporters have been at odds with each other for the last few months, struggling on the debate of education policy reform. Unable to agree upon a solution, the result has been the eruption of student protests across the country.

These protests have been covered by media outlets worldwide, often featuring negative images of the few individuals who cause trouble. Most media attention focuses on people fighting with each other, and with the police, showing the resulting arrests and damage to public property. While this is one characteristic of the protests, there is another side of the story that isn’t always covered by the media. That side is of the great majority of the participants in the protest; the individual citizen, who is marching peacefully to show their concern for the issue at hand.  As an organization, we do not take sides on political issues of this nature, however, we support a citizen’s right to express their content or discontent with their government. In this context, and for the purpose of encouraging civic engagement through information technology, Fundación Ciudadano Inteligente, (Smart Citizen Foundation, http://www.votainteligente.cl/) along with Public Laboratory, adapted the idea of balloon mapping to our own needs. We wanted to demonstrate and strengthen the perspective of viewing protests from the citizen’s point of view, in order to broadcast to the world the majority, rather than the minority of the behavior of the attendees these events. We wanted to show a grassroots movement from a truly grassroots perspective.


The objective was to cover the student protests in a way that was inexpensive, and easily replicable by almost anyone. The materials were simple: an iPhone 3G connected to the internet, string, helium, and balloons. We used a string to connect the camera phone and balloons, which were elevated to approximately 20 feet in the air, and controlled by a member of our team. The phone was connected to the internet, which allowed us to live stream the protest on our website. In only two hours, we had an incredible following; over 10,000 people viewed the protest live from our site, and Fundación Ciudadano Inteligente’s twitter account had thousands of hits and comments. This far exceeded the number of daily visits that we have on our website and showed the impact that this project could really have.

Approximately one week later, in preparation for the next round student protests, Fundación Ciudadano Inteligente translated the Public Laboratory’s Guide to Balloon Mapping into Spanish. We uploaded it onto our website, (http://www.ciudadanointeligente.cl/marcha/armatuglobo.html) as well as handed it out to demonstrators at the protest. We wanted to encourage Chilean citizens to construct their own balloon map, allowing them to show their own point of view of the protests. The reception to this idea was very positive and people were excited to realize that they could broadcast their own aerial view of the protest, with any webcam, or camera connected to the internet.


This new idea also captured the attention of the media. Within the two weeks of live streaming the event, Ciudadano Inteligente was featured on Teletrece and TVN, both Chilean news stations that broadcast nationwide. We also had several radio station interviews on the topic. Much to the credit of the incredible citizen and media reception of this project, this site is now an extension of Fundación Cuidadano Inteligente, (http://www.ciudadanointeligente.cl/marcha/) that we hope to use to live stream future protests.

We live in a world where connectivity is immediate and the potential for video virility is one tweet, or one post away. In the instance of balloon mapping protests, the fact that any handheld webcam, or phone with internet connection can be used to capture protests live, allows for the potential of thousands of views, and thus increasing the power of individual self expression and citizen engagement. Now ordinary people don’t necessarily have to rely solely on media broadcasting for coverage of a protest. This enables them not only to see the peaceful activity of the majority of the demonstration participants, but to show their own version of it to the world. This use of global mapping can truly put the power of the dispersion of visual information in the hands of everyday people, the majority of people, to show the positive and peaceful side of grassroots movements as they are happening.


We hope that because of the nature of the feasibility of construction of the Balloon Mapping, for these purposes, more people will construct their own in the future. All of this can be done with easily accessible materials that almost anyone, almost anywhere, can find, allowing for the transformation of the perception of protests; from a literal top down, to bottom up, approach.

In future demonstrations, we hope to look up and see a rainbow of balloons dotting the sky!

Links:

http://www.ciudadanointeligente.cl/marcha/

http://www.ciudadanointeligente.cl/marcha/armatuglobo.html

http://www.votainteligente.cl/

Recorded Videos:

http://www.youtube.com/ciudadanointeligente#p/u/7/VfPPLPoKlzU

http://www.ustream.tv/recorded/15715893

http://www.ustream.tv/recorded/15990823

http://www.ustream.tv/recorded/15714706

Balloon-mapping a protest in Jerusalem

July 21st, 2011 by Jeffrey Warren

protest against the occupation, Jerusalem, 15/72011.

Grassroots Mapping בשיתוף עם חגית קיסר ושי אפרתי, הטיסו מספר פעמים מצלמה מותקנת על בלון הליום מעל ראשיהם של למעלה מ-3000 משתתפי צעדת “צועדים לעצמאות” בירושלים. הצעדה עברה ממערב העיר למזרחה, ביום שישי, ה-15 ליולי 2011. הצילומים נעשו בהשראת Vota Inteligente שלאחרונה שידרו שידור חי מעל להפגנת מחאה בסנטיאגו, צ’ילה, ו BIT Balloon documentation שנעשה על ידי נטלי ג’רמיג’נקו במהלך גלי מחאות סביב הכנס הרפובליקאי הלאומי בארה”ב, 2004.

Grassroots Mapping together with Shai Efrati and Hagit Keysar launched a balloon several times over the heads of more than 3000 people in the march for Palestinian Independence, in Jerusalem. The march went from west to east Jerusalem, Friday July, 15 2011. Taking inspiration from Vota Inteligente’s recent balloon live-streaming of protests in Santiago Chile, and Natalie Jeremijenko’s BIT Balloon documentation of the RNC protests in New York City in 2004.

You can read more about the protest here: http://www.en.justjlm.org/557

http://publiclaboratory.org/place/santiago-chile

http://www.wired.com/culture/lifestyle/news/2004/08/64720, Bit Balloon, 2004

Balloon map of demonstration against Israeli occupation of Gaza and the West Bank

The completed stitched map is here:

Introducing the Grassroots Mapping Forum – a printed map journal

July 7th, 2011 by Jeffrey Warren

Hello mappers etc!

We’ve just launched the first issue of the “Grassroots Mapping Forum”, our new community research journal/archive/zine/map, where we hope to share ideas, techniques, and stories from the Grassroots Mapping community. (For those of you who don’t know, we are a community of activist cartographers who use DIY tools for civic science — we take aerial photos using kites and balloons of things like the BP oil spill.)

The front of every issue, which is essentially a giant printed map, will depict a Grassroots Mapping site — the first one is of an island in Wilkinson Bay, Louisiana, with oil residue along a wetlands coastline. It is printed on a single 22.75×35″ sheet, folded down to just over letter size, and includes a full color reproduction of a grassroots map along with essays, illustrated guides, and interviews on the reverse.

You can find out more, and purchase the first issue here for $17 shipped:
http://publiclaboratory.org/forum

If you’re interested in supporting Public Laboratory’s work, consider buying 3 or 4 and giving them to your friends.

The first issue of the Grassoots Mapping Forum was sponsored by DevelopmentSeed, creators of MapBox, and we are looking for sponsors for future maps. If you’re interested, please get in touch.

Jeff & the Public Laboratory team

The Public Laboratory for Open Technology and Science Receives Support for Expanding Civic Science Programs

June 22nd, 2011 by Jeffrey Warren

Dear Grassroots Mappers / Public Laboratory community:

We have some great news to share: the Public Laboratory for Open Technology & Science has just been awarded a Knight News Challenge grant to support citizen-based, grassroots data gathering and research.

We are grateful to be working with all of you and want to let you know that we will be focused on further developing our hardware and software tools, and supporting on-the-ground initiatives.

We will be setting up spaces in several cities – please get in touch, especially if you’ve been reading this list but haven’t spoken up there will be even more varied ways to participate in the community.

The full press release is below. (PDF)

See you outside!
Jeff, Shannon, Adam, Sara, Mathew, Stewart, Liz

(Above photo, left to right: Adam, Jeff, Shannon, Sara, Leif, and Liz)


NEWS RELEASE — FOR IMMEDIATE RELEASE

June 22, 2011

BOSTON, MA– The Public Laboratory for Open Technology and Science announced today that it will use a $500,000, three-year Knight News Challenge grant to create a toolkit and online community for citizen-based, grassroots data gathering and research. The News Challenge, a project of the John S.and James L. Knight Foundation, is an international contest to fund digital news experiments using technology to inform and engage communities. 

The Public Lab is an expansion of Grassroots Mapping – one of the most successful projects developed through the Center for Future Civic Media at MIT. During the project, residents used helium-filled balloons and digital cameras to generate high-resolution D.I.Y “satellite” maps gauging the extent of the Gulf of Mexico oil spill – at a time when there was little public information on the subject. Expanding the toolkit beyond aerial mapping, Public Laboratory will work with communities, both online and offline, to produce information about our surroundings.

“Knight Foundation’s support underscores the increasing importance of civic technologies and the need for local-level involvement in collecting and interpreting environmental information,” said Jeffrey Warren, Research Director at Public Lab. “This generous grant will help us to develop and launch new projects with our local partners as well as expand upon our existing programs.”

“At Knight Foundation, we’re interested in supporting efforts to connect on-line activity with off-line action,” said John S. Bracken, Director of Digital Media at Knight Foundation. “In Public Lab, we found a skilled partner that is experimenting with tools and behaviors that inform and engage local communities in fascinating ways. We look forward to seeing what this investment yields.”

With the BP oil spill Grassroots Mapping project as a pilot, Public Laboratory has already begun a series of new collaborations focused on locally produced environmental and civic data. Over the next three years, seven local chapters of Public Laboratory will be created around the United States to support community action with new low-cost, accessible tools and technologies. Ranging from infrared vegetation monitoring to thermal photography for home insulation, these projects will be developed in collaboration with local community and advocacy groups to address specific local issues. Drawing from the participatory and Do-It-Yourself techniques which have generated hundreds of gigabytes of citizen-produced environmental map data in the Gulf of Mexico, the Public Lab plans to tackle new problems in new places, while developing a long-term approach to jump-starting and sustaining such efforts on a broader scale.

About the Public Laboratory for Open Technology and Science

The Public Laboratory for Open Technology and Science (PLOTS) is a community which develops and applies open-source tools to environmental exploration and investigation. By democratizing inexpensive and accessible “Do-It-Yourself” techniques, Public Laboratory creates a collaborative network of practitioners who actively re-imagine the human relationship with the environment.

The core PLOTS program is focused on “civic science” in which we research open source hardware and software tools and methods to generate knowledge and share data about community environmental health. Our goal is to increase the ability of underserved communities to identify, redress, remediate, and create awareness and accountability around environmental concerns. PLOTS achieves this by providing online and offline training, education and support, and by focusing on locally relevant outcomes that emphasize human capacity and understanding. For more information, please visit publiclaboratory.org.

About the John S. and James L. Knight Foundation

Knight Foundation supports transformational ideas that promote quality journalism, advance media innovation, engage communities and foster the arts. We believe that democracy thrives when people and communities are informed and engaged.

Contacts

Public Laboratory for Open Technology and Science: Jeffrey Yoo Warren, Research Director; phone: 504.358.0647; email: jeff@publiclaboratory.org

John S. and James L. Knight Foundation: Marc Fest, Vice President for Communications; phone: 305.908.2677; email: Fest@knightfoundation.org

Humboldt Park, Chicago mapping with Jen Hudon

June 15th, 2011 by Jeffrey Warren

Grassroots Mapping from James Warden on Vimeo.

Jen Hudon posted last week about mapping in Humboldt Park in Chicago. Sounds like they had a blast! She writes:

We had quite a few technical difficulties on Saturday for the Chicago Grassroots Mapping Workshop, including a broken kite string reel, not enough helium, and a malfunctioning camera. However, the team remained optimistic and had a great time learning more about the Public Laboratory and the many grassroots mapping projects, all while experimenting with cameras, mylar balloons and kites. The group was very interested and impressed with all of the collaborations and developments with the software and hardware – so kudos to everyone involved.

Grassroots Mapping awarded Honorary Mention at Prix Ars Electronica

June 2nd, 2011 by Jeffrey Warren

The Grassroots Mapping project was recently awarded an Honorary Mention at the 2011 Prix Ars Electronica:

http://new.aec.at/prix/en/gewinner/#digital-communities

Congratulations and thanks to everyone who helped make this happen!

Since 1987, the Prix Ars Electronica has served as an interdisciplinary platform for everyone who uses the computer as a universal medium for implementing and designing their creative projects at the interface of art, technology and society.

The “Digital Communities” category focuses on the wide-ranging social and artistic impact of the Internet technology as well as on the latest developments in social software, user generated content, mobile communications, mash-ups and location based services. Digital Communities” focuses on innovation in relation to human coexistence. Its main goals lie in first, bridging the geographical as well as the genderbased digital divide and second, bridging across cultural conflicts and third, supporting cultural diversity and freedom of artistic expression.